Overview
HuskyCT (Blackboard LMS) offers a range of analytics tools to monitor and enhance student progress. These tools provide insight in relation to student engagement, assignment completion, and overall course performance, enabling faculty to make data-driven decisions. Comprehending and leveraging these features allows instructors to identify trends, address potential issues, and create a supportive learning environment tailored to individual and class-wide needs.
Helpful Hints:
- Begin exploring the analytics tools early in the course to ensure smooth integration.
- Use these insights to proactively support students at risk of falling behind.
Progress Tracking
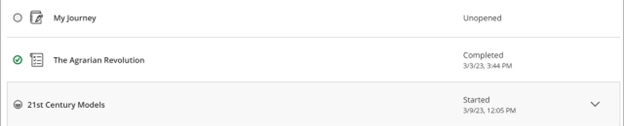
Progress Tracking allows students and instructors to visually monitor task completion throughout a course. When enabled, students see indicators reflecting their status: an empty circle for unattempted tasks, a half-filled circle for ongoing work, and a green checkmark for completed items. Instructors can view detailed student progress through the “Student Progress” option, accessible in the assignment settings. This feature also records data such as the number of times an assignment was accessed, the time spent, and its completion status. For non-assignment items, such as documents, students will need to manually mark these items as complete. This allows instructors to track student engagement with all types of of course content, ensuring a comprehensive view of student progress and who may need additional guidance.
Helpful Hints:
- Ensure Progress Tracking is activated at the start of the course to maximize its utility.
- Regularly review individual and class-wide progress to tailor your support strategies.
- Review Progress Tracking and Student Progress Reports in the Blackboard LMS Help Center.
Analytics Tab
The Analytics tab in HuskyCT is a central hub for monitoring student performance and engagement. It offers five key sub-tabs:
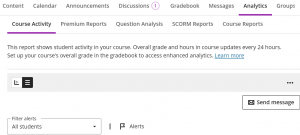
- Course Activity: Provides a snapshot of student engagement, including time spent in the course, overall grades, missed due dates, and time since last access. This tab is particularly useful during active teaching periods as the data is not available in the course once the semester or course ends.
- Premium Reports: Retains data beyond the course duration and includes detailed insights such as student activity trends and submission records.
- Question Analysis: Question analysis provides statistics on overall performance, assessment quality, and individual questions.
- SCORM Reports: SCORMs are less frequently used but information will be listed here is you do use them. The limitation of this report are listed below.
- Course Reports: This report shows the goals coverage for a course highlighting covered areas, gaps, and aligned course items. The limitation of this report are listed below.
These tools allow instructors to identify at-risk students, analyze behavioral trends, and evaluate overall course effectiveness.
Helpful Hint:
- Review Analytics in the Blackboard LMS Help Center.
Course Activity
Helpful Hints:
- Use “Course Activity” data during active semesters to quickly identify students who may require additional academic support.
- Leverage the scatter plot and matrix views to develop actionable strategies for enhancing student engagement.
Premium Reports
Premium Reports provide a deeper dive into student and course analytics, offering long-term data retention for post-course analysis. This sub-tab has four listed options:
- Course at-a-Glance
- Activity and Grade Scatter Plot
- Activity Matrix, and
- Course Submission Summary
The following sections will detail each type of premium report.
Course at-a-Glance (Premium Report)
The “Course at-a-Glance” report compares metrics such as time spent, submission rates, and final grades within your course against similar departmental courses. While comparisons to other courses offer broader context, though this data is generally less actionable. Instead, the most valuable insights lie in the detailed student-specific metrics available at the bottom of the report (, as this information is more directly applicable to the course). Additionally, the report provides a detailed breakdown of individual student activities, such as items accessed and time spent on each item. This granular data can help instructors identify specific areas where students may need additional support or resources.
Helpful Hints:
- Use student-level insights for targeted interventions and detailed performance discussions.
- Focus on actionable trends rather than broad comparisons to other courses.
Activity and Grade Scatter Plot (Premium Report)
The “Activity and Grade Scatter Plot” is a visualization tool that displays a scatter plot comparing students’ overall grades against their level of course access. The plot includes a regression line, providing an overview of how student activity correlates with academic performance. By clicking on individual data points, instructors can access detailed profiles of students to review their engagement and performance in the course. This tool is particularly effective for identifying students who are underperforming despite high activity levels or those who may need additional academic support to succeed.
Helpful Hints:
- Use the scatter plot early in the term to identify students who need support and plan interventions.
- Focus on students who fall below the regression line for tailored engagement strategies.
Activity Matrix (Premium Report)
The “Activity Matrix” presents a color-coded grid or heat map that highlights the relationship between student activity levels and their grades. The matrix categorizes students into regions such as high activity/high grades (blue) and low activity/low grades (red). Weekly interaction data is also displayed, providing insights into student engagement trends over the term. By clicking on a student’s name, instructors can access detailed reports about their participation and performance. This feature is invaluable for understanding patterns of engagement and addressing issues before they impact final outcomes.
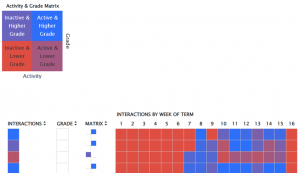
Image above: This image displays a pop-up course that begins in the second 7-week term. As you can see, students were not enrolled until week 7. The blue areas indicate high activity, while the red areas show lower activity.
Helpful Hints:
- Use the matrix to prioritize outreach to students in the low activity/low grades category.
- Leverage weekly trends to assess the effectiveness of specific course activities or materials.
- Review Course Activity Report in the Blackboard LMS Help Center.
Course Submission Summary (Premium Report)
The “Course Submission Summary” aggregates key details about student submissions, including their enrolled status, overall average, date of the last submission, days since the last submission, and the type of the last submission (e.g., test or discussion). Instructors delve down further by clicking on a student’s name to view a timeline of their submission activity, interaction logs, and participation in the course. This feature is particularly useful for monitoring student consistency and addressing submission issues proactively.
Helpful Hints:
- Review the summary regularly to track patterns of late submissions and offer support where needed.
- Use individual timelines to discuss submission trends during student consultations.
Question Analysis
Accessed from the main Analytics tab or from a specific test/quiz, Question Analysis is a valuable feature for evaluating the quality and performance of assessments. It generates detailed reports on metrics such as average scores, time spent, and completion rates. It also includes statistical measures for question difficulty and discrimination, helping instructors identify which questions effectively assess knowledge and which need revision. Questions rated as “poor” in discrimination or marked as overly difficult/easy are highlighted for review, ensuring that assessments remain fair and valid for all students.
- Discrimination: Shows the number of questions that fall into the Good (greater than 0.3), Fair (between 0.1 and 0.3), and Poor (less than 0.1) categories. A discrimination value is listed as Cannot Calculate when the question’s difficulty is 100% or when all students receive the same score on a question. Questions with discrimination values in the Good and Fair categories are better at differentiating between students with higher and lower levels of knowledge. Questions in the Poor category are recommended for review.
- Difficulty: Shows the number of questions that fall into the Easy (greater than 80%), Medium (between 30% and 80%) and Hard (less than 30%) categories. Difficulty is the percentage of students who answered the question correctly. Questions in the Easy or Hard categories are recommended for review and are shown by “needs review” in the column.
The Test Questions section provides metrics for each question on the exam. Reviewing each question will allow you to decide if you want to give any credit back or review question validity for a future iteration of the course.
Helpful Hints:
- Regularly review Question Analysis results to ensure test fairness and reliability.
- Revise or remove poorly performing questions to improve future assessment quality.
- Review Question Analysis in the Blackboard LMS Help Center.
SCORM Reports
SCORM reports are less frequently used compared to the other reports. Additional details can be found within the Blackboard LMS Help Center resource on SCORM Packages.
Course Reports
This report shows the goals coverage for a course highlighting covered areas, gaps, and aligned course items. Goals will also have to be set in your course to use this functionality. A generated report will not cover certain content, such as SCORM and LTI, and uses a snapshot of data that may be up to 24 hours old.
Other Analytics in the Course
Your course contains additional analytics ranging from assignments to discussions to even Kaltura videos.
Student Activity for Assignments & Discussions
The Student Activity tools for assignments and discussions provide detailed engagement metrics. For discussions, instructors can view data such as the number of posts, average word count, and participation grades. This data can identify the most active participants and highlight students who have not yet engaged. For assignments, the tool tracks submission timing, attempts, and grades. It also logs when students accessed and started an assignment, providing a timeline of their activity.
Helpful Hints:
- Use discussion activity metrics to encourage balanced participation across students.
- For assignments, review submission timing to identify potential procrastination patterns.
- Review Student Activity Details for Assessments and View Discussion Performance and Analytics in the Blackboard LMS Help Center.
Video Analytics – Kaltura
Video Analytics tools like Kaltura offer valuable insights into how students interact with multimedia content. Kaltura’s Media Gallery provides detailed viewing data, such as the number of plays, average view duration, and peak engagement times.
Helpful Hints:
- Analyze video viewing data to optimize content length and structure.
- Use peak engagement times to comprehend which segments resonate most with students.
- Resources are linked in the narrative of Kaltura and YouTube above.
Additional Resources
Related Resources
- Analytics (Blackboard LMS Help Center)
- Progress Tracking and Student Progress Reports (Blackboard LMS Help Center)
- Question Analysis (Blackboard LMS Help Center)
- View Discussion Performance and Analytics (Blackboard LMS Help Center)